
Daily Commodity Market Analysis -- 5/18/2026
- Clayton Pope

- May 17
- 5 min read

Contract | Close | Net Change |
Corn July '26 | 477 | +21 1/4 |
Corn Dec '26 | 498 | +17 |
Beans July '26 | 1213 | +36 |
Beans Nov '26 | 1201 | +30 1/4 |
Wheat-Chi July '26 | 664 1/2 | +28 3/4 |
Wheat-KC July '26 | 703 3/4 | -15 3/4 |
Wheat-MN July '26 | 703 1/4 | +18 |
Cotton Dec '26 | 83.98 | +2.07 |
Crude Oil June '26 | 104.43 | +3.41 |
US Dollar Index | 99.06 | -.15 |
Dow Jones | 49686 | +160 |
Daily Glance commodity market
What a difference a day makes---big across the board strength in response to yesterday's release by the White House of a "fact sheet" detailing what was supposedly agreed on at the US/China summit last week. As communicated earlier, China has reportedly agreed to buy $17 billion of US ag products for each year from 2026-2028. This commitment is described as being in addition to the US reporting that China had previously agreed to buy 25 MMT of soybeans during each of the same three years. Importantly, neither one of these "commitments" has even been mentioned in any Chinese communication. But that certainly didn't bother today's market interpretation of the announcement where we saw solid strength in the grain markets from the opening of the night session all the way through to today's close.
How much of this has been officially announced is a little hazy, but reportedly this agreement is the result of the two parties agreeing to lower or even drop the tariffs that have been in place. This includes the tariffs China has on US products including 10% on soybeans, 15% on feed grains, and 55% on US beef. Correspondingly, the US is reportedly preparing to lower or drop the tariff on US importation of fentanyl and various other broad based tariffs on Chinese goods (10% in most cases).
By the close, corn ended within a cent of session highs and soybeans only 5-6 cents off of their session highs, both (as well as Chicago wheat) ended above the Friday session highs.
Outside markets were very volatile as well, with crude ending higher, and a mixed stock market. |
Key Points/Developments:
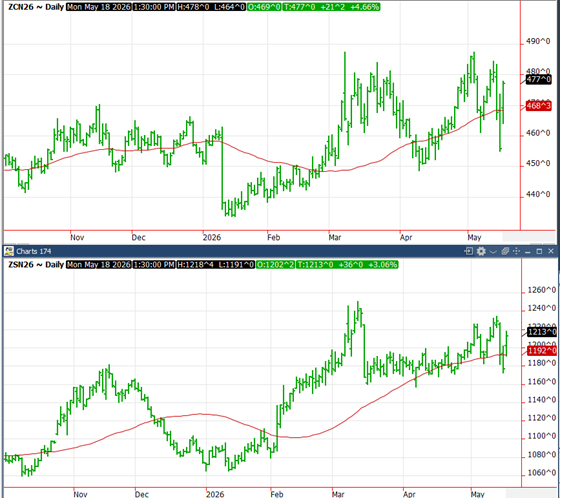
Technicals: Another very quick reversal in the corn technical picture, this time to the upside, completely reversing Friday's seemingly negative close. Back above the (still upward sloping) 50 day average, we move support up to the 50 day average of 468, and at 460-462. We see resistance as we approach the previous high at 487 and then at 492-494 .
July soybeans' rebound moves support up to 1202 and then at the 50 day average of 1192, and below at 1180-1182. Resistance is now seen at 1219, 1233-1235, and the previous high near 1250.
Spreads: The July/November inverse received a boost on today's flat price strength, gaining almost 6 cents to end at 12 and posting an daily upside reversal. The July/Dec corn spread tightened today by about 4 cents, ending at a 21 cent carry, after having traded as high as 25 3/4 on Friday. Our comment Friday was that there didn't "appear to be any "fuel" to tighten it in the foreseeable future"...well, it got that needed "fuel" today, and it is very likely the high on that spread occurred on Friday.
Weather: TStorm now has global conditions for both corn and soybeans as Neutral, and for wheat, Favorable. The US forecast looks crop friendly for most areas: There are no changes to the T-storm Weather Outlook with a stormy period ahead for at least the southern third to half of the central U.S.
A cold front triggers scattered to organized t-storms within the southeast half of the central U.S. today-tomorrow, while some rain moves across the Dakotas today. Temperatures will be cold enough for some frost in the western and northern Plains tomorrow morning.
The front stalls in OK-TX and the mid-South for areas of rain and t-storms Wed.-Fri. A separate system flows along the southern edge of coolness to bring rain to much of the central Plains and southern half to two-thirds of the Corn Belt Thu.-Sat., and a few showers further north.
Coolness departs Sat.-Mon. to allow for sharp warming in the Plains, but a cool front or two are probable to pass one to two weeks out to prevent temperatures from being unusual. Some t-storms precede each front to bring some t-storms to varying areas, especially with southward extent as normal to wet conditions potentially develop from OK-TX through the mid-South and southern Corn Belt. |
Markets/Trading Implications
Our comment in Friday's letter that the "lack of any grain specific news coming from the US/China summit is certainly a disappointing result" was certainly corrected with yesterday's announcement indicating that the summit reportedly produced a lot more results than initially indicated. The White House "fact sheet" sheds a very different light on our markets, and as we also said on Friday, the S&D changes leave very little room for error, and there is seemingly even less room for error now with this strong indication of a potentially large jump in demand.
The announcement certainly played perfectly into the funds' hands as they have maintained their large net long positions, and clearly added to them in a big way today. The magnitude of the announcement is big--consider that if the value of the previously announced commitment by China to buy 25 MMT of soybeans each of the next three years is close to $12 billion, and then add that to the $17 billion....that implies that China has reportedly committed to buying somewhere around $29 billion of US ag products each of the next three years! To put this in perspective, look at this table which shows the total $ amount of Chinese buying over each of the past 10 years. As you can see, they have only exceeded $29 billion in only 2 of the past 10 years, and we are already approaching the half way point of 2026 and their purchases to date are only $8 billion. So, as there is no doubt that yesterday's news is "bullish", the market is now expecting some confirmation of this big boost in Chinese buying very soon, and it is important that we see some signs of that to avoid disappointment

Other Notes
Here are daily charts of July corn and soybeans, just to put today's moves in perspective:
Static Notes
The Commitment of Traders report for trading through Tuesday, May 12 showed actively traded funds sold a net 44k corn contracts, taking net longs down to a still very large 300k contracts. They sold 7k soybeans, bringing net longs down to 215k, and sold 9k Chicago wheat, increasing net shorts to 19k.
In the corresponding week of price activity, July corn was unchanged, July beans gained 27 cents, and Chicago wheat gained 51 cents. In the three days since this report, corn lost 24 cents, soybeans lost 50 cents, and Chicago wheat lost 43 cents.
The following table is a "bird's eye" view of our recommended sales levels. Please note that these are meant to be very general guidelines and do not apply to all readers due to the critical differences and unique situations that may exist. Among other possible differences, those current with the following coverage levels might be perfectly comfortable with the expectation of buying some of these sales back at lower levels, whereas others might have no interest in doing so. commodity market
Crop Year | 2025/26 | 2026/27 | 2027/28 |
Corn | 80% | 40% | 0% |
Soybeans | 85% | 40% | 0% |
Wheat | 100% | 30% | 0% |
Have a nice evening!
Clayton and Taylor
commodity market
RISK DISCLAIMER:Trading in futures products entails significant risks of loss which must be understood prior to trading and may not be appropriate for all investors. Please contact your account representative for more information on these risks. Past performance of actual trades or strategies cited herein is not necessarily indicative of future performance.

Comments